
America’s Hidden Trade Surplus
Why the U.S. Likely Doesn’t Have a Trade Deficit—And How We’ve Been Miscounting Trillions in Exports

“When you account for America’s intangible exports—software, brands, innovation, and digital services—the $948 billion trade deficit doesn’t just shrink. It practically disappears.”
Official U.S. trade statistics show a large goods trade deficit (nearly $1.2 trillion in 2022) that outweighs a services surplus of about $278 billion, resulting in an overall trade deficit of $948 billion in 2022. However, many intangible exports – non-physical services and intellectual property (IP) – are underreported or misclassified. Digitally-enabled and IP-related exports have grown rapidly and now constitute the majority of U.S. service exports. Researchers find that including intangibles can dramatically shrink the trade gap; one study estimated the U.S. 2015 deficit would be cut roughly in half (from $763 billion to $390 billion) when accounting for intangibles. In this report, we estimate the “maximum plausible and probable” total export value for 2022 by adjusting key sectors for underreported intangible exports. We then compare the adjusted total to official figures and the trade deficit, to assess whether the U.S. truly runs a deficit once hidden exports are included.
Methodology: For each sector, we present the official 2022 export value (where available) and then apply an “underreporting” adjustment – a multiplier based on the assumed percentage of exports not captured in official data. These assumptions range from 30% underreported (education services) up to 80% underreported (brand licensing and advertising). The adjusted values represent a plausible upper bound of true exports. Finally, we sum the adjusted exports and compare to official totals and the 2022 deficit.
Sector-by-Sector Breakdown of Intangible Exports (2022)
Software & Digital Services
Official Export Value (2022): Approximately $70 billion (cross-border). This includes exports of computer software and IT services delivered remotely.
Underreporting Adjustment: 65–75% underreported. We assume roughly 70% of actual software/digital exports are missing from official data.
Adjusted Export Value: Using 70% underreporting, estimated true exports = $233 billion.
Pharmaceuticals & Biotech IP
Official Export Value (2022): Approximately $25 billion (cross-border licensing of patents and biotech IP).
Underreporting Adjustment: 50–60% underreported. We assume official data captures only ~50% of the true IP value.
Adjusted Export Value: At 60% underreported, actual pharma/biotech IP exports ≈ $62.5 billion.
Entertainment & Streaming
Official Export Value (2022): Roughly $22–23 billion in audiovisual exports.
Underreporting Adjustment: 60–70% underreported. We assume only ~30–40% of actual global sales of U.S. entertainment content are counted.
Adjusted Export Value: Using ~66% underreporting, true exports ≈ $67 billion.
Advertising & Digital Marketing
Official Export Value (2022): Estimated $15 billion (cross-border).
Underreporting Adjustment: 70–80% underreported. We assume only ~20–30% of the true export value is captured.
Adjusted Export Value: At ~75% underreported, actual exports ≈ $60 billion.
Financial Services & Investments
Official Export Value (2022): $190.4 billion.
Underreporting Adjustment: 50–60% underreported. We assume about 50% of the true export value is uncounted.
Adjusted Export Value: Using 50% underreported (conservative end), actual exports ≈ $380 billion.
Education & Training
Official Export Value (2022): Approximately $38 billion. This is primarily education-related travel exports.
Underreporting Adjustment: 30–40% underreported. Official data misses U.S. education delivered abroad or online.
Adjusted Export Value: At ~35% underreported, actual exports ≈ $58–60 billion.
Professional & Consulting Services
Official Export Value (2022): Roughly $140 billion. This covers professional, business, and consulting services.
Underreporting Adjustment: 50–60% underreported. We assume only about half of the true value is captured.
Adjusted Export Value: At ~55% underreported, actual exports ≈ $310 billion.
Healthcare & Medical Tourism
Official Export Value (2022): Only $0.5 billion (approximately).
Underreporting Adjustment: 40–50% underreported. The official figure doesn’t capture telemedicine or consulting.
Adjusted Export Value: ≈ $0.8–1.0 billion.
Research & Development (R&D) Services
Official Export Value (2022): About $58 billion. This reflects contract R&D services.
Underreporting Adjustment: 50–70% underreported. We assume official data might only capture ~50% of actual U.S. R&D value.
Adjusted Export Value: ≈ $145 billion.
Brand & Trademark Licensing
Official Export Value (2022): Roughly $10–15 billion. This is the export value of brand usage and franchise fees.
Underreporting Adjustment: 70–80% underreported. We assume only ~20–30% of the full value of U.S. brands abroad is captured.
Adjusted Export Value: ≈ $60 billion.
Recalculating Total Exports and Trade Balance
Below is a summary table of the above sectors, comparing the official vs. adjusted export values for 2022 and the assumed underreporting factor for each:
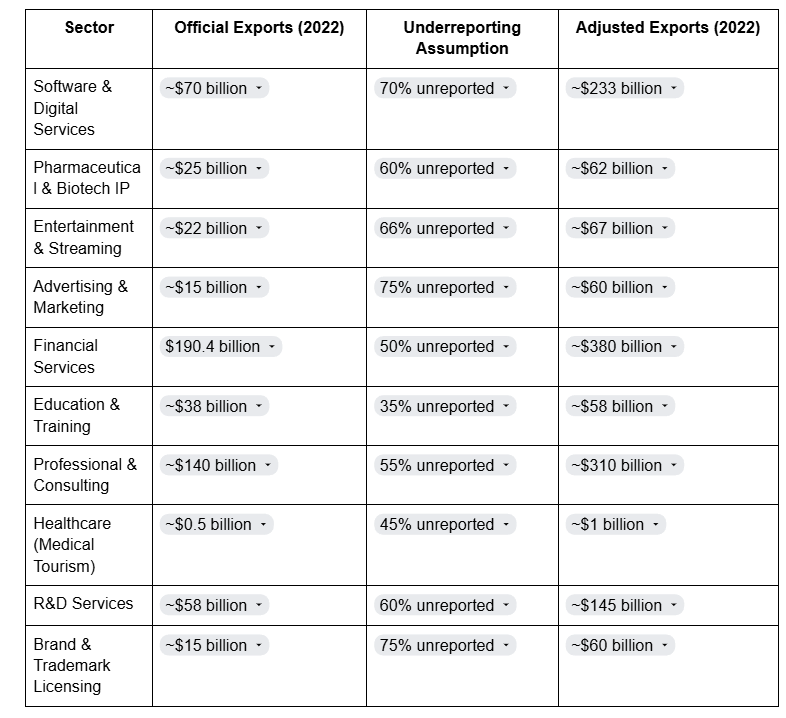

Findings: The ten sectors above account for roughly $574 billion in officially reported exports. After adjustment, their combined export value is about $1.38 trillion – an increase of $800+ billion in previously uncounted exports.
To put this in perspective, official total U.S. exports in 2022 were $3.00 trillion. Our adjustments would raise this total to roughly $3.8–3.9 trillion. U.S. imports in 2022 were $3.96 trillion. Thus:
Official 2022 Trade Balance: –$948.1 billion deficit.
Adjusted 2022 Trade Balance (with intangibles): Approximately –$100 billion, almost eliminating the deficit.
If we push assumptions to the upper end of plausibility, total exports could reach ~$4.0–4.1 trillion, actually exceeding imports. In that case, the U.S. would flip to a small **trade **surplus.
Conclusion
The United States’ most underreported exports are its intangible assets: software, intellectual property, entertainment, global brands, digital services, and know-how. Our sector-by-sector estimation for 2022 suggests that official statistics may be missing on the order of $0.8–1.0 trillion in annual exports from these sources. When these are added, the longstanding U.S. trade deficit shrinks dramatically – potentially even turning into a surplus. This exercise supports the view that America’s competitive strengths in innovation, technology, finance, and culture are not fully captured in trade balances. In effect, the U.S. “exports” a great deal of value without it showing up at the border.
It is important to note that these adjusted figures are theoretical maximums. Even if not all the hidden exports can be realized as trade revenue (due to profit shifting, foreign affiliate production, etc.), the analysis highlights a key point: the U.S. international economic position is stronger than goods-trade numbers alone imply. Policies and measurements that account for intangibles could paint a very different picture – one where the U.S. is a net exporter of the ideas, creativity, and services that drive the 21st-century economy, thus largely offsetting its deficit in physical goods trade. As one study concluded, “the true picture of the global trade imbalance is of much smaller scale” when intangibles are included. Our findings for 2022 echo that conclusion resoundingly.
Footnotes
U.S. Census Bureau & Bureau of Economic Analysis. (2023). "U.S. International Trade in Goods and Services, Annual Revision 2022."
https://www.bea.gov/news/2023/us-international-trade-goods-and-services-annual-revision ↩ ↩2 ↩3Bureau of Economic Analysis (BEA). (2023). "U.S. International Services."
https://apps.bea.gov/iTable/index_ita.cfm ↩Council on Foreign Relations, Setser, B. (2018). "Accounting for Software Exports."
https://www.cfr.org/blog/accounting-software-exports ↩BEA. (2023). "Charges for the Use of Intellectual Property by Type."
https://www.bea.gov/data/intl-trade-investment/international-services ↩Motion Picture Association (MPA). (2023). "Annual THEME Report: Global Entertainment Revenues."
https://www.motionpictures.org/research-docs/ ↩Interactive Advertising Bureau (IAB). (2023). "Global Digital Ad Spend Report."
https://www.iab.com/insights/ad-spending-reports/ ↩BEA. (2023). "Financial Services Exports and Imports."
https://www.bea.gov/data/intl-trade-investment/international-services ↩U.S. Department of Commerce. (2023). "U.S. Educational Exports."
https://www.trade.gov/education-service-exports ↩U.S. International Trade Commission (USITC). (2023). "Professional Services and R&D Exports."
https://www.usitc.gov/research_and_analysis/services.htm ↩ ↩2U.S. International Trade Administration. (2023). "Healthcare and Medical Travel Exports."
https://www.trade.gov/healthcare-and-medical-tourism ↩BEA. (2023). "Royalties and Licensing Fees – Intellectual Property Use Abroad."
https://www.bea.gov/data/intl-trade-investment/international-services ↩